
Having a website is a crucial part of operating a business in today’s world. However, building an online presence is not enough. It’s also necessary to learn about site visitors and what they do. The best web analytics tools can help your organization identify and quantify site traffic, giving your team meaningful insights into its audience.
What Is Web Analytics Software?
At its core, web analytics software captures and displays web traffic data. These tools break down several aspects of a website’s traffic:
- Who comes to the site
- How they arrived there
- What pages they visit
- How long they stay
- Whether they’re first-time or returning visitors
Web analytics tools can also answer broader questions, such as “Has the average traffic level gone up or down over the past month?” or “How have a site’s recent updates affected user engagement levels?”
Best Web Analytics Tools
The internet is full of web analytics options. However, here are five worthwhile solutions for you to consider.
Google Analytics
Statistics indicate that 56.6% of all websites use Google Analytics to monitor traffic. Perhaps this is because it’s the name that immediately comes to mind regarding online analytics. It also helps that users can start using Google Analytics for free.
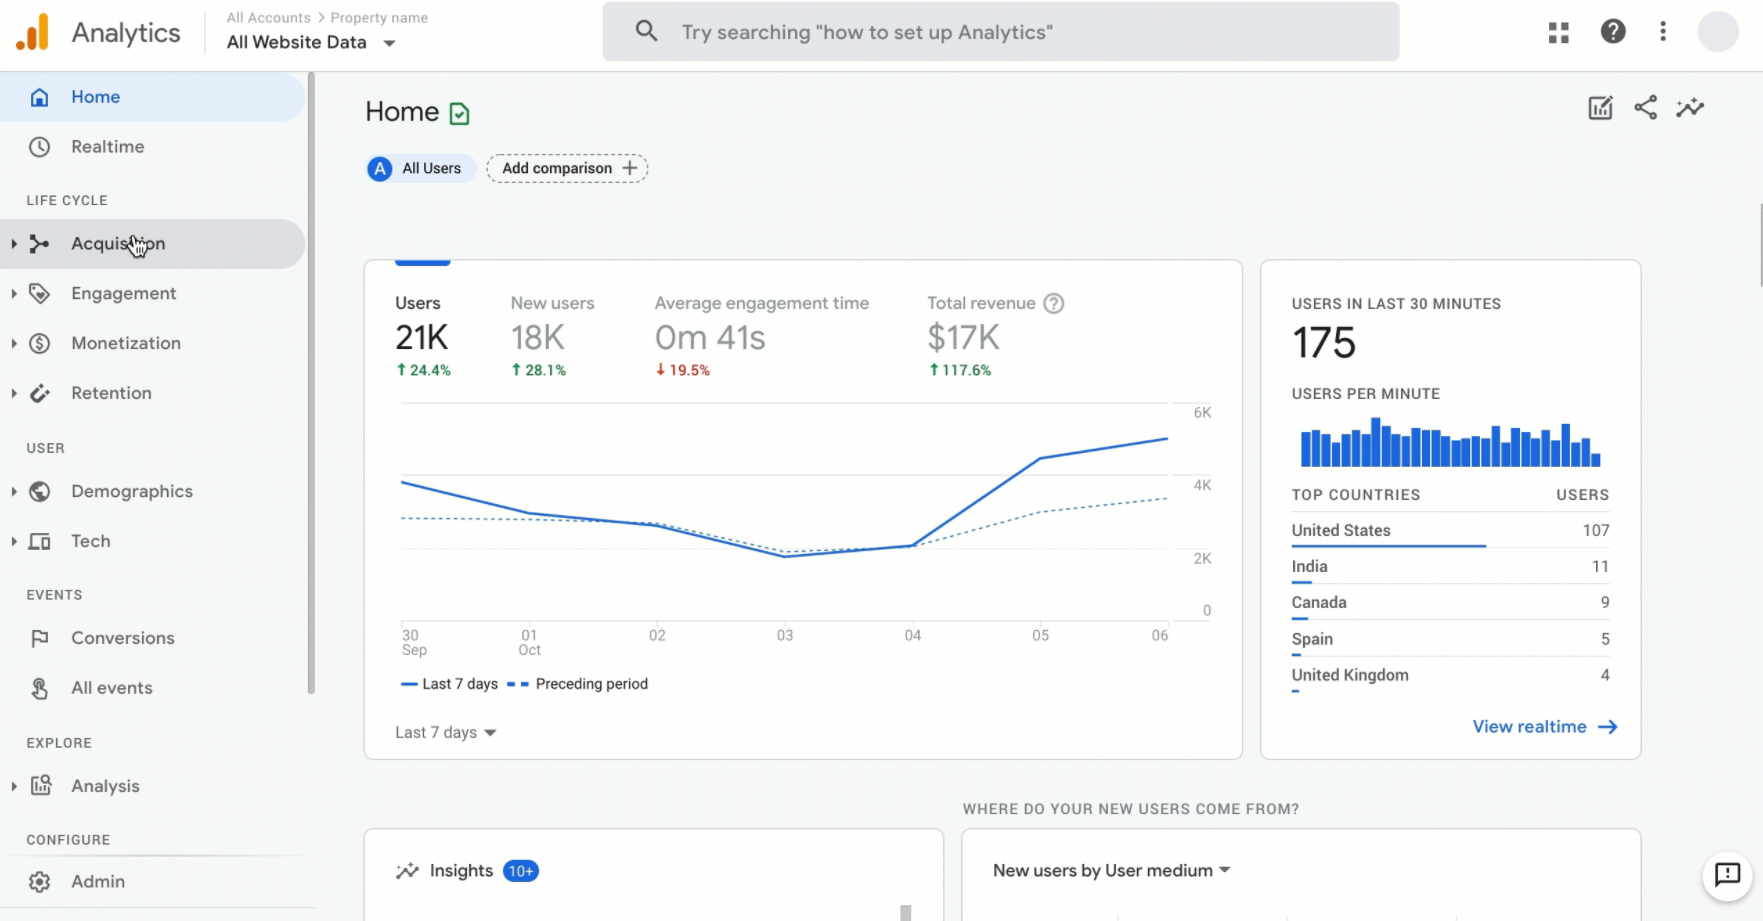
The platform offers a wide assortment of valuable metrics. For example, a person can determine the lifetime value of different users based on their activity across sessions. It’s also possible to track the number of active users on a site or app across several specific timeframes, such as by day or week. Google Analytics tracks ad performance, too. It calculates how many people clicked on a particular ad and eventually landed on the website.
One standout feature is the platform’s Behavior Flow Report. This tracks what happened as users moved from one page or engagement event to the next. For example, did a person decide to sign up for a company’s newsletter after reading a particular blog post?
Adobe Analytics
Adobe Analytics is another feature-filled platform for getting web traffic specifics. Use the fallout and flow visualizations to determine how people move through predefined sequences, and where they become disinterested. The Analysis Workspace allows people to build custom projects to study their data using a drag-and-drop approach.
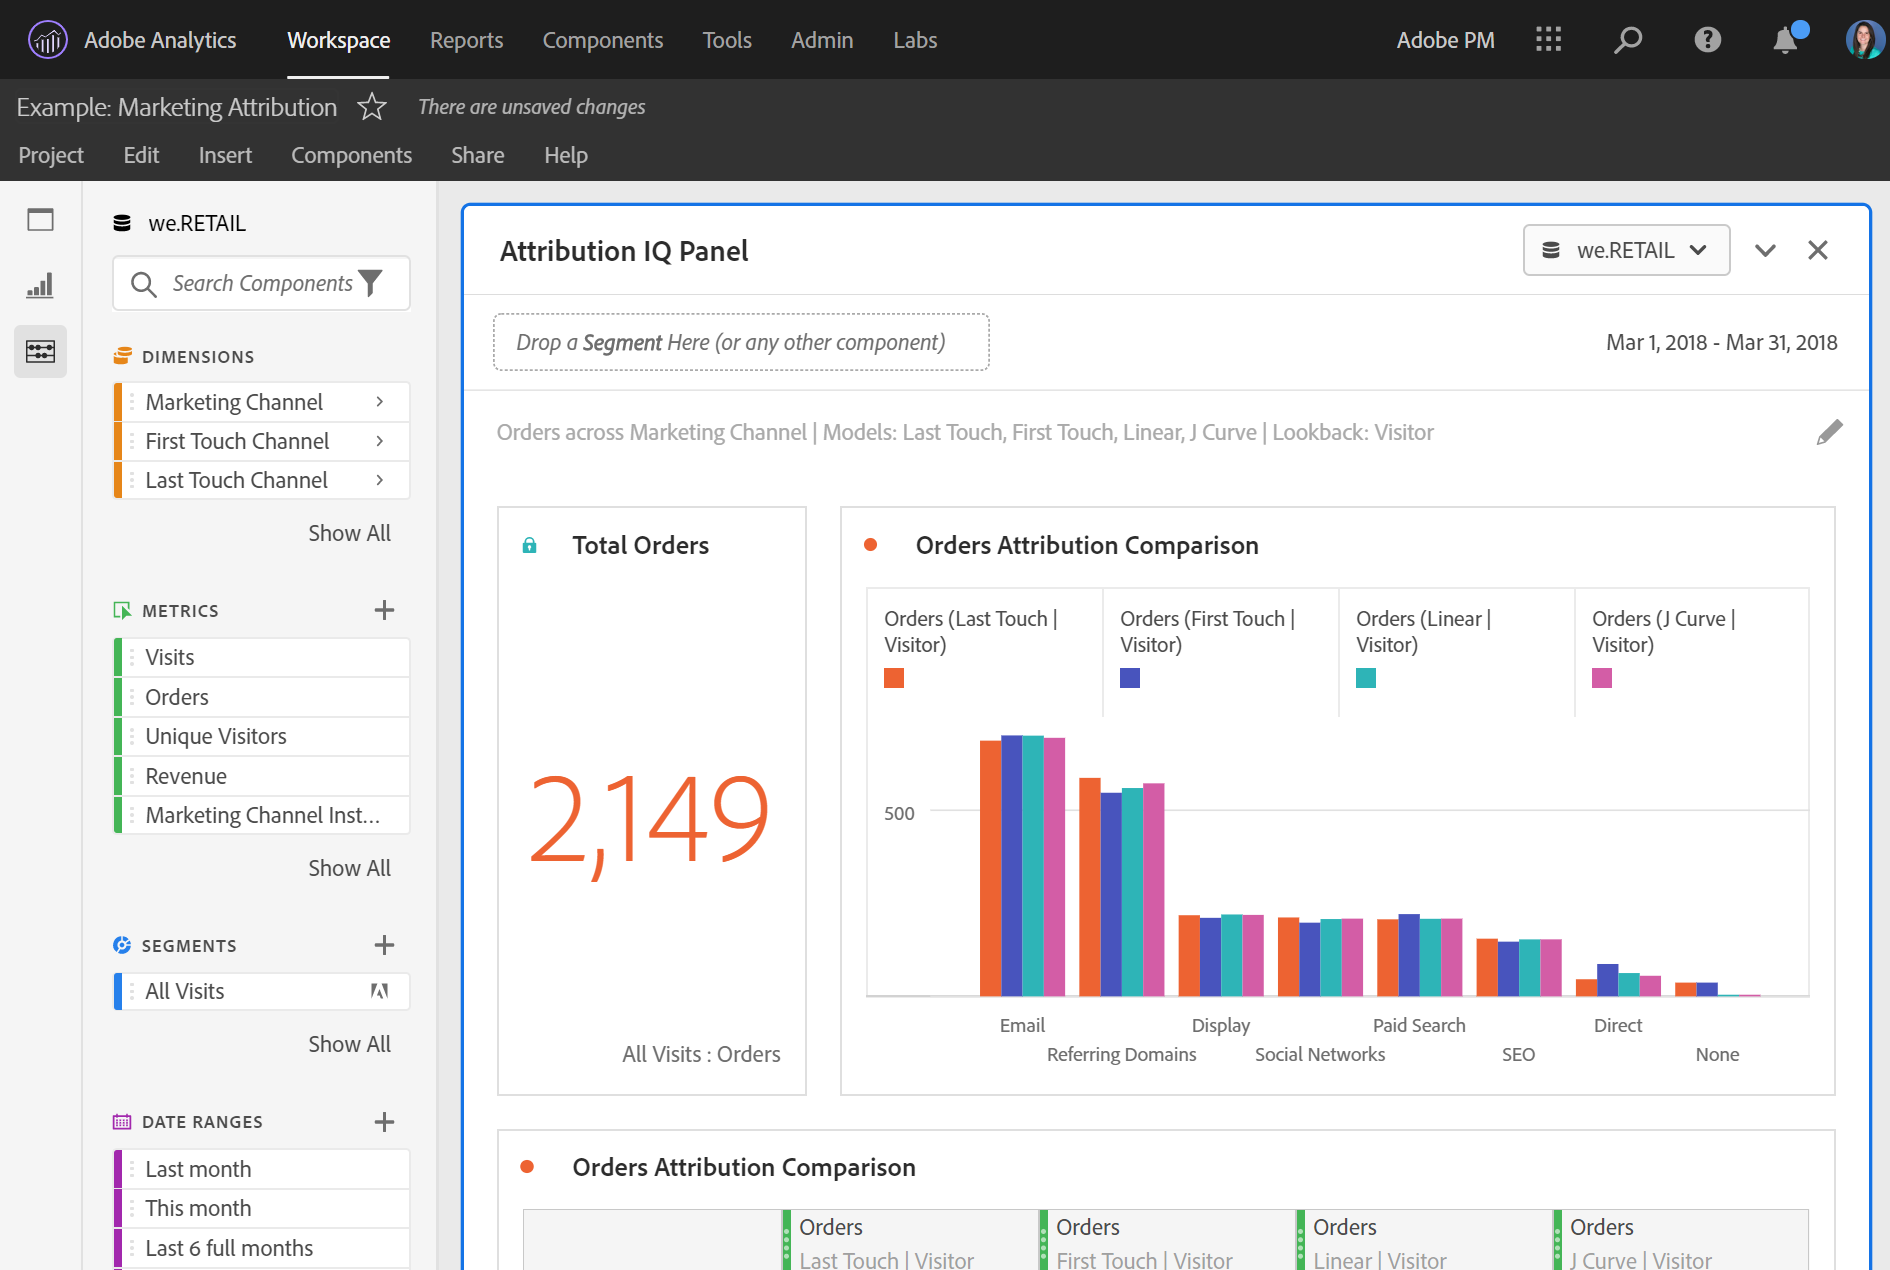
The advanced segmentation capabilities show the shared characteristics of user groups most affecting a company’s KPIs. Built-in data cleaning and preparation features are ideal for when business representatives are short on time or labor.
Adobe Analytics customers can also invest in related products, such as those with predictive analytics and tools that show how the target audience interacts across all of a business’s marketing channels. Similarly, attribution data shows the precise value of each asset used to appeal to consumers, whether it’s a company’s e-book or a branded video. Those details help leaders understand what’s working well, and when it’s time to make adjustments.
AT Internet Analytics Suite
This product offers more than 400 prebuilt analyses, making it easier for users to experience web analytics benefits without a lot of work to get started. For example, they can determine how many visitors come to a website via sponsored content versus direct traffic. The product also goes beyond web analytics to show the effects of a company’s email marketing campaigns.
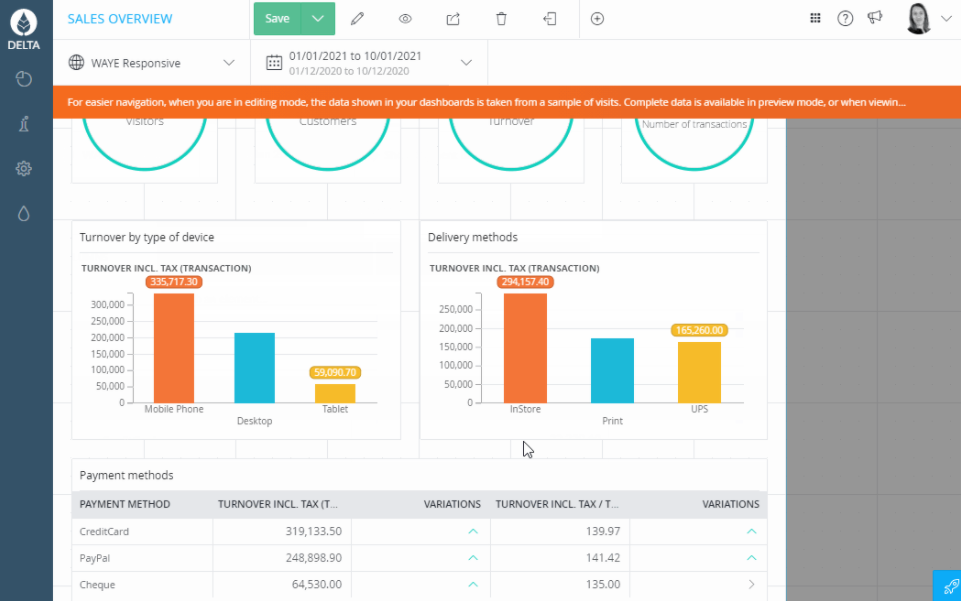
Determine which page sequences on a website most often lead to conversions, or which parts of the site frequently cause people to leave. Then, use that information to make immediate and long-term site improvements.
Many customers use more than one device before reaching a decision. For example, they might initially visit a law firm’s site on a desktop computer, but use a smartphone to fill out a form to request a consultation. Besides showing what devices people are most likely to use at a site, AT Internet Analytics Suite features breakdowns of when people use different devices during their visits.
Statcounter
Statcounter’s website claims more than 2 million websites use this tool for tracking user visits. That impressive number alone suggests it’s worth checking out. The platform’s user activity feed shows real-time details of how people engage with a site, and where they go during a visit. Users can also examine visitor paths to see which pages they most often land on before taking certain desirable actions.
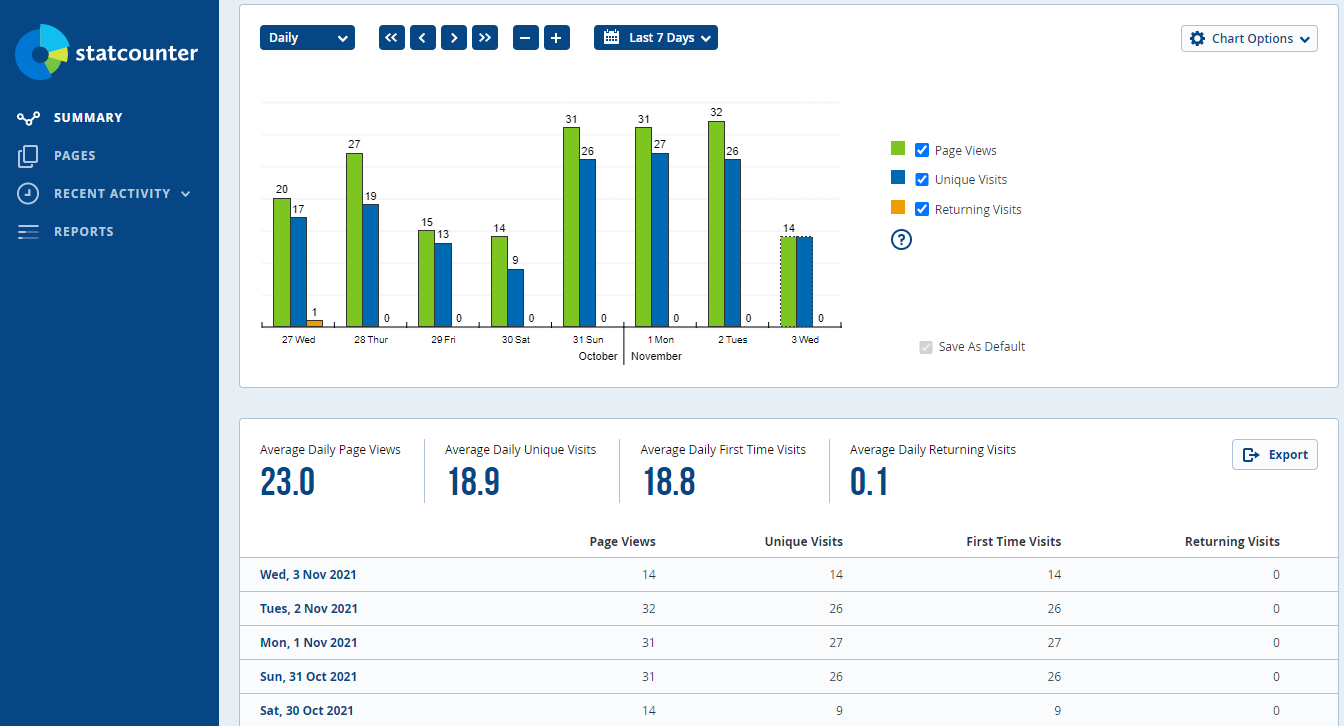
Take a closer look at bounce rates by seeing the percentage of visits for individual pages. That data reveals a company’s best-performing pages and where room for improvement exists. Statcounter can also send daily site metric reports to designated email addresses, helping people get current data to make smarter decisions.
Statcounter has user location statistics, too. Users can segment visitors by country or get more specific and group them by IP address.
Mixpanel
Web analytics isn’t always straightforward, but Mixpanel aims to eliminate guesswork by putting need-to-know information at a user’s fingertips. Generate retention reports to learn the shared characteristics of a company’s most loyal customers. See their average relationships with the business, too.
Create team dashboards and set up alerts for particular statistics. Perhaps an employee wants to measure the number of new site visitors who became clients over the last three months. Alternatively, maybe they need to track how many people filled out a form on a website to sign up for a rewards program. Mixpanel enables setting custom analytics alerts in minutes and sharing them with relevant team members.
Make user segments based on actions, cohorts, or attributes. Mixpanel also allows examination of how a campaign launch affected web traffic and conversions. Whether a company publishes a new white paper, or adds an offer code to a podcast ad, this platform lets people see how those decisions influence user traffic and behaviors.
Must-Have Features for Web Analytics Software
When people begin researching web analytics software, they typically prioritize several features that will help them make the most of a tool. For example, mobile device compatibility would be especially advantageous for people who often do things from their phones.
Data Visualization
Data visualization is a useful feature for helping people see information in an easy-to-digest format. It’s then more likely they can act on it and make confident decisions.
Social Media Insights
Many web analytics platforms let people examine social media traffic. That’s a significant benefit when company leaders want to verify how effective social campaigns are at getting people to visit a website. In any case, potential web analytics users should look for traffic-filtering features that let them drill down into data.
Data Exporting
Data exportation capabilities are also often on people’s must-have features lists. It’s understandably handy to download the information in a common format and import it elsewhere.
Keyword Analysis
What someone considers essential for web analytics tools varies based on their company and how they intend to use the new insights. Some people use analytics tools to capitalize on trends. For example, 2019 data showed an uptick in consumers searching for the keyword phrase “gift box” from their phones during the holiday shopping season. A web analytics platform could show whether keyword tweaks to site content can help traffic levels.
Are Free Web Analytics Tools Worth It?
The web analytics space has a wide assortment of free tools, and many people wonder if it’s worth trying to use those rather than paying for a product. There’s no universally correct answer, but it’s worth noting that many paid tools have lengthy free trials. They help a business evaluate a platform’s merits before committing to it.
Benefits of Web Analytics Software
By using web analytics software, business representatives can see whether a website’s content and features have the desired effects on the target audience. This software can also show a company’s performance related to its key performance indicators (KPIs). Most companies set four to 10 KPIs at once. Web analytics platforms make it easier to measure gains.
For example, those tools can show whether a new content strategy brings the engagement rise company leaders want. Content marketing expert Robert Katai said, “I really believe that brands should create content that can just be in the mind of the user.” If visitors don’t engage with content, it’s probably not memorable.
Analyzing web traffic reveals whether the site’s material matches visitors’ needs and expectations.
Analyzing web traffic also reveals whether the site’s material matches visitors’ needs and expectations. If a site has a high bounce rate, people may not be finding what they thought they would.
Orbit Media’s Andy Crestodina positions analytics tools as output boosters, saying, “The reason to use analytics is to stop wasting time and to abandon those tactics and processes that don’t make a difference.”
Web analytics increase shareholder transparency, too. However, company representatives must explain how specific data connects to business goals. Rattling off a series of statistics during an earnings call is not sufficient by itself. People also want to know how the relevant information translated into a company’s success.
A company’s profitability and marketplace resilience are too important to leave to assumptions. Web analytics tools bring the hard data and context that help decision-makers enhance their websites and keep visitors returning.
Read next: How to Create a CRM Strategy (Step-by-Step Guide)