Related Topics
Articles
View All Link to Best Supply Chain Certifications to Get 
Best Supply Chain Certifications to Get
A supply chain management certification demonstrates your knowledge and application of best supply chain principles. Applying learned principles in the workplace decreases operational expenses, maintains high product quality, keeps customers satisfied, and helps your organization remain competitive in its industry.
Link to Can't Hire a CIO or CISO? Go Virtual 
Can't Hire a CIO or CISO? Go Virtual
Pay rates for C-level execs in IT have skyrocketed amidst an acute shortage of IT talent, the rush towards digitalization, and an unprecedented wave of cyberattacks.
Link to Best Business Travel Items: 11 Business Travel Essentials 
Best Business Travel Items: 11 Business Travel Essentials
After more than two years of travel restrictions spurred by the COVID-19 pandemic, business travel may seem like a thing of the past. However, many tech conferences and other events have started to resume in person this year, which means it may be time to dust off your suitcase.
Link to IBM on the Evolving Role of the CIO: Interview with Kathryn Guarini, CIO of IBM 
IBM on the Evolving Role of the CIO: Interview with Kathryn Guarini, CIO of IBM
The chief information officer (CIO) has always balanced a variety of IT and business leadership responsibilities. As more enterprise technologies become enmeshed in customer and employee experiences, though, the role of the CIO is expanding and evolving to meet stakeholder expectations.
Link to Brainstorming Solutions for the Tech Labor Shortage: Interview with Rob Kim at Presidio 
Brainstorming Solutions for the Tech Labor Shortage: Interview with Rob Kim at Presidio
Enterprise technologies continue to grow more sophisticated to meet new business needs, and as a result, technical job roles are expanding in number and complexity around the globe. Some companies are successfully recruiting the tech professionals they need to deploy and manage their most important applications and infrastructure.
Link to MLOps: What Is It and Why Do We Need It? 
MLOps: What Is It and Why Do We Need It?
Recently, machine learning (ML) has become an increasingly essential component of big data analytics, business intelligence, predictive analytics, fraud detection, and more. Because there is a plethora of methods and tools businesses can use to analyze their data, companies must select an ML approach that minimizes cost and maximizes efficiency.
Articles
View All Link to How Businesses Use Unstructured Data for Business Intelligence 
How Businesses Use Unstructured Data for Business Intelligence
Without the right tools to analyze this data, companies are missing out on a wealth of information that informs business intelligence. However, it is important to know how to leverage unstructured data in service of a business's broader goals.
Link to AI vs Machine Learning: What Are Their Differences & Impacts? 
AI vs Machine Learning: What Are Their Differences & Impacts?
AI vs machine learning and deep learning. These words conjure visions of decision-making computers replacing whole departments and divisions — a future many companies believe is too far away to warrant investment.
Link to Coda vs Notion: Which Is Better For Project Management? 
Coda vs Notion: Which Is Better For Project Management?
Coda and Notion challenge the traditional software tools like word processors and spreadsheet programs made so famous by Microsoft and Google. Instead of single-purpose applications, Coda and Notion created comprehensive workspaces that contain all of the capabilities of documents, tasks, databases, and spreadsheets.
Link to 5 Tips For Fostering Enterprise Network Security 
5 Tips For Fostering Enterprise Network Security
Cybersecurity has become a major topic of discussion in the business world. The rising frequency of cyberattacks—combined with several high-profile breaches in the past few years—has put the spotlight on the impact a successful attack can have.
Link to What is Serverless Computing? 
What is Serverless Computing?
Serverless computing uses cloud-based infrastructure and provides instant access to a scalable system that runs your code on-demand and scales automatically. Developers outsource infrastructure responsibilities to an external vendor or cloud provider.
Link to Storage Vulnerabilities: The Neglected Cybersecurity Frontier 
Storage Vulnerabilities: The Neglected Cybersecurity Frontier
A 2021 study by Continuity details the fact that lack of storage security is putting a great many organizations at risk. Based on an analysis of more than 400 high-end storage devices, over 6,000 discrete vulnerabilities, misconfigurations, and other security issues were detected.
Articles
View All Hover to load posts
Articles
View All Hover to load posts
Articles
View All Hover to load posts
Articles
View All Hover to load posts

-
IT Management Related TopicsLink to Best Supply Chain Certifications to Get Best Supply Chain Certifications to GetA supply chain management certification demonstrates your knowledge and application of best supply chain principles. Applying learned principles in the workplace decreases operational expenses, maintains high product quality, keeps customers satisfied, and helps your organization remain competitive in its industry.Link to Can't Hire a CIO or CISO? Go Virtual Can't Hire a CIO or CISO? Go VirtualPay rates for C-level execs in IT have skyrocketed amidst an acute shortage of IT talent, the rush towards digitalization, and an unprecedented wave of cyberattacks.Link to Best Business Travel Items: 11 Business Travel Essentials Best Business Travel Items: 11 Business Travel EssentialsAfter more than two years of travel restrictions spurred by the COVID-19 pandemic, business travel may seem like a thing of the past. However, many tech conferences and other events have started to resume in person this year, which means it may be time to dust off your suitcase.Link to IBM on the Evolving Role of the CIO: Interview with Kathryn Guarini, CIO of IBM IBM on the Evolving Role of the CIO: Interview with Kathryn Guarini, CIO of IBMThe chief information officer (CIO) has always balanced a variety of IT and business leadership responsibilities. As more enterprise technologies become enmeshed in customer and employee experiences, though, the role of the CIO is expanding and evolving to meet stakeholder expectations.Link to Brainstorming Solutions for the Tech Labor Shortage: Interview with Rob Kim at Presidio Brainstorming Solutions for the Tech Labor Shortage: Interview with Rob Kim at PresidioEnterprise technologies continue to grow more sophisticated to meet new business needs, and as a result, technical job roles are expanding in number and complexity around the globe. Some companies are successfully recruiting the tech professionals they need to deploy and manage their most important applications and infrastructure.Link to MLOps: What Is It and Why Do We Need It? MLOps: What Is It and Why Do We Need It?Recently, machine learning (ML) has become an increasingly essential component of big data analytics, business intelligence, predictive analytics, fraud detection, and more. Because there is a plethora of methods and tools businesses can use to analyze their data, companies must select an ML approach that minimizes cost and maximizes efficiency. -
IT Strategy Link to How Businesses Use Unstructured Data for Business Intelligence How Businesses Use Unstructured Data for Business IntelligenceWithout the right tools to analyze this data, companies are missing out on a wealth of information that informs business intelligence. However, it is important to know how to leverage unstructured data in service of a business's broader goals.Link to AI vs Machine Learning: What Are Their Differences & Impacts? AI vs Machine Learning: What Are Their Differences & Impacts?AI vs machine learning and deep learning. These words conjure visions of decision-making computers replacing whole departments and divisions — a future many companies believe is too far away to warrant investment.Link to Coda vs Notion: Which Is Better For Project Management? Coda vs Notion: Which Is Better For Project Management?Coda and Notion challenge the traditional software tools like word processors and spreadsheet programs made so famous by Microsoft and Google. Instead of single-purpose applications, Coda and Notion created comprehensive workspaces that contain all of the capabilities of documents, tasks, databases, and spreadsheets.Link to 5 Tips For Fostering Enterprise Network Security 5 Tips For Fostering Enterprise Network SecurityCybersecurity has become a major topic of discussion in the business world. The rising frequency of cyberattacks—combined with several high-profile breaches in the past few years—has put the spotlight on the impact a successful attack can have.Link to What is Serverless Computing? What is Serverless Computing?Serverless computing uses cloud-based infrastructure and provides instant access to a scalable system that runs your code on-demand and scales automatically. Developers outsource infrastructure responsibilities to an external vendor or cloud provider.Link to Storage Vulnerabilities: The Neglected Cybersecurity Frontier Storage Vulnerabilities: The Neglected Cybersecurity FrontierA 2021 study by Continuity details the fact that lack of storage security is putting a great many organizations at risk. Based on an analysis of more than 400 high-end storage devices, over 6,000 discrete vulnerabilities, misconfigurations, and other security issues were detected. -
News & Trends -
Blogs -
Case Studies -
-
Books for CIOs


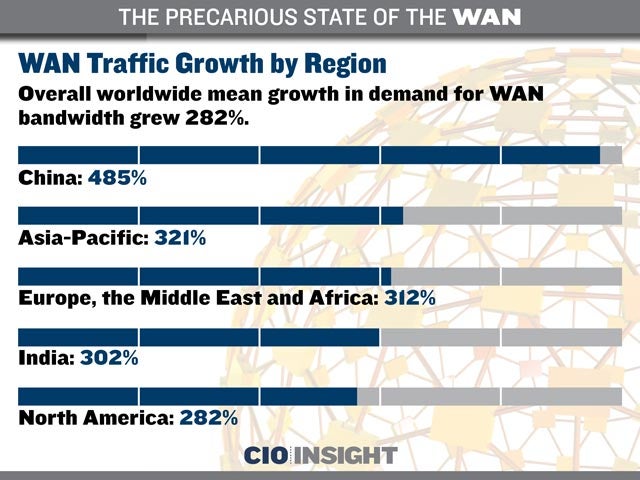 WAN Traffic Growth by Region
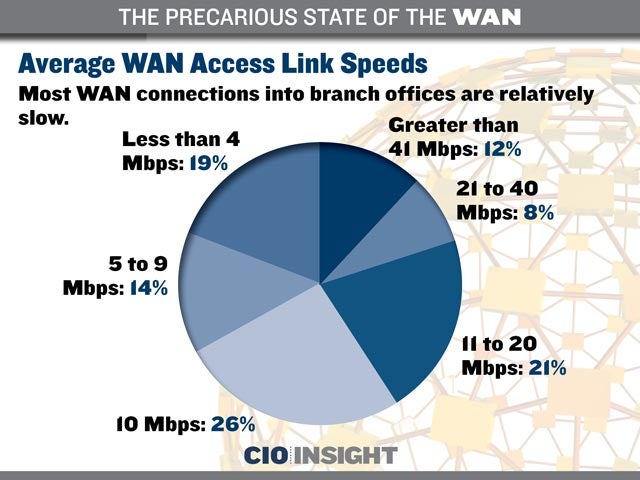 Average WAN Access Link Speeds
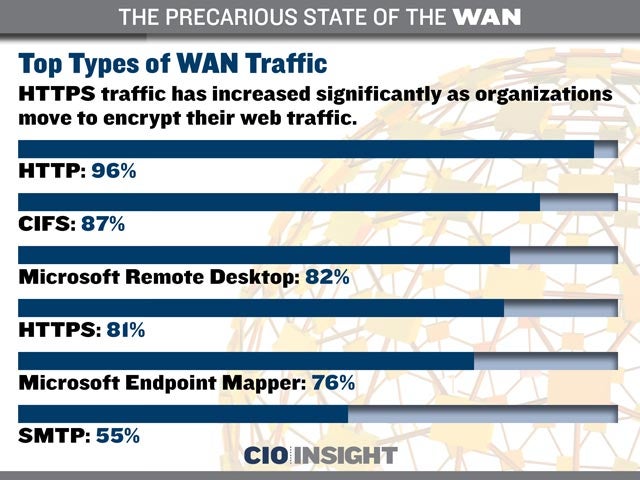 Top Types of WAN Traffic
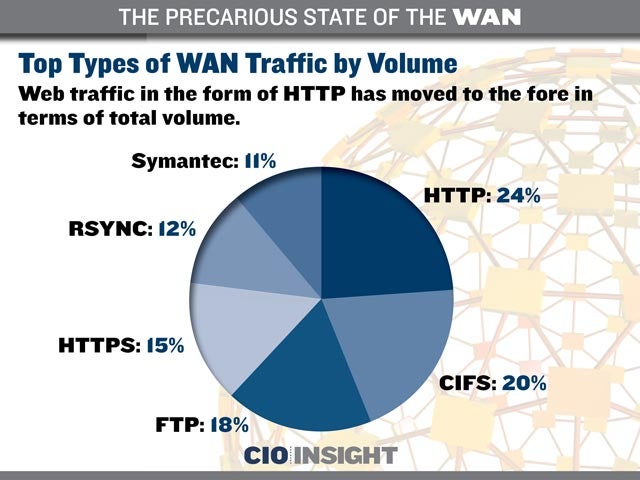 Top Types of WAN Traffic by Volume
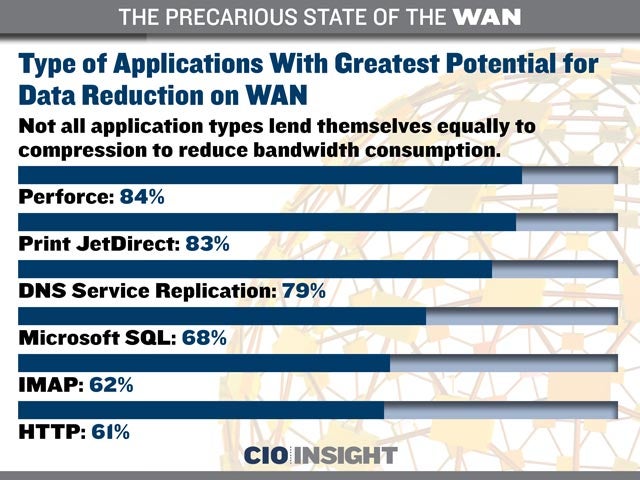 Type of Applications With Greatest Potential for Data Reduction on WAN
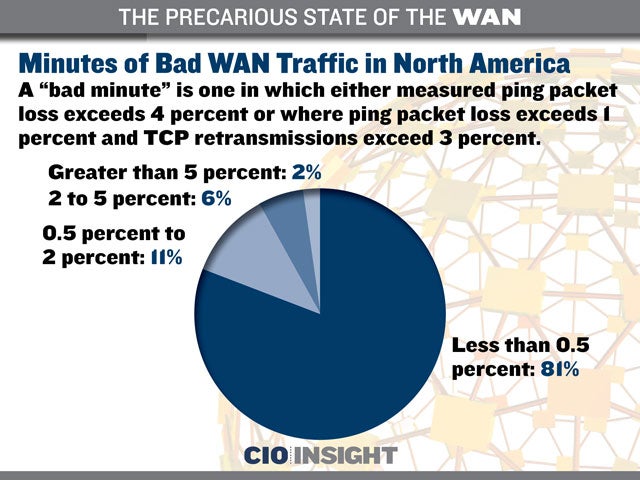 Minutes of Bad WAN Traffic in North America
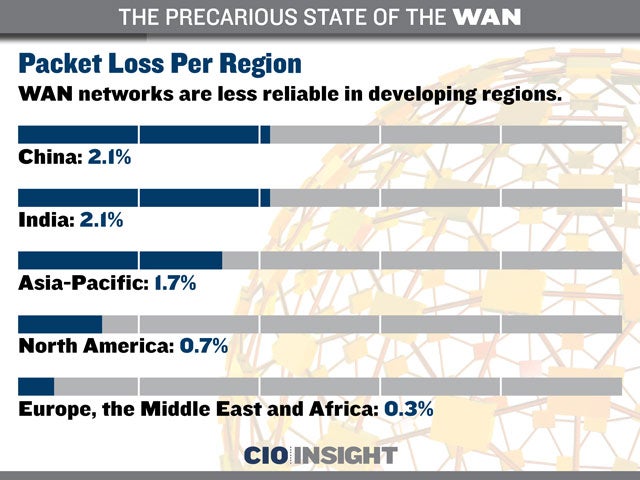 Packet Loss Per Region
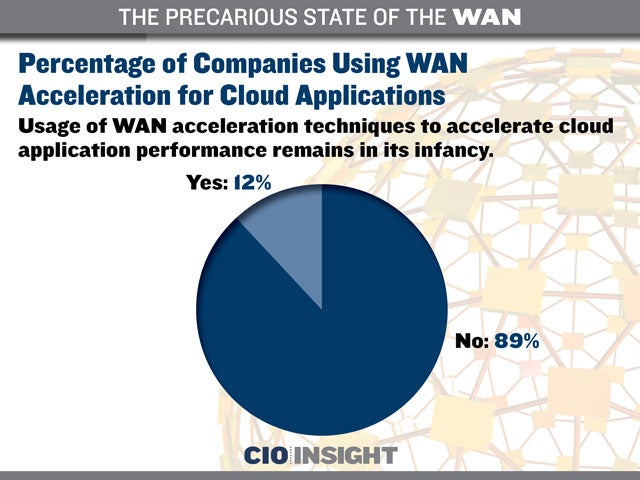 Percentage of Companies Using WAN Acceleration for Cloud Applications
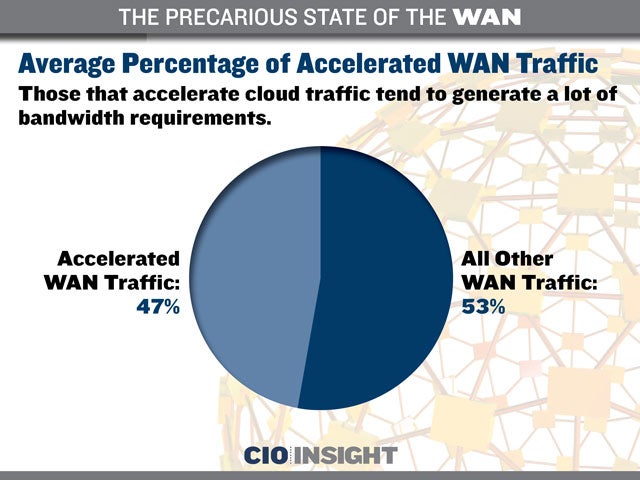 Average Percentage of Accelerated WAN Traffic