
The Precarious State of the WAN
 WAN Traffic Growth by Region
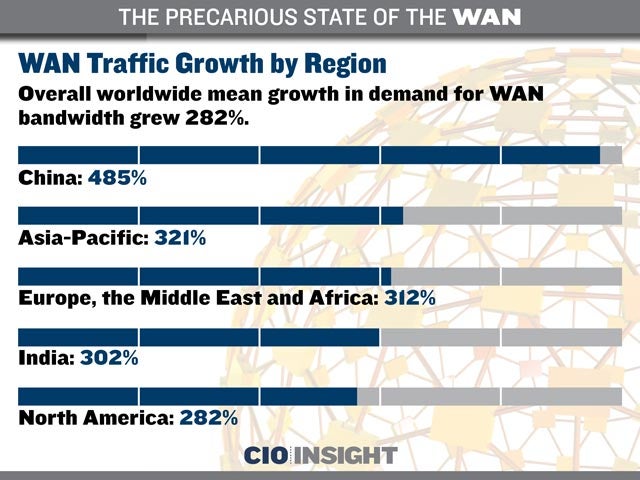
Overall worldwide mean growth in demand for WAN bandwidth grew 282%. China: 485%, Asia-Pacific: 321%, Europe, the Middle East and Africa: 312%, India: 302%, North America: 282%
 Average WAN Access Link Speeds
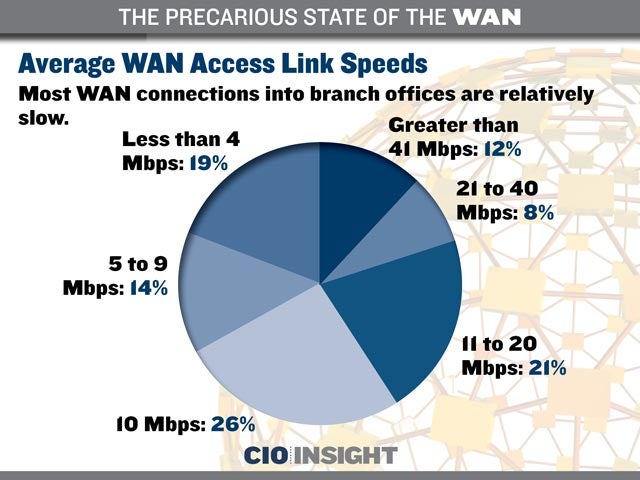
Most WAN connections into branch offices are relatively slow. Greater than 41 Mbps: 12%, 21 to 40 Mbps: 8%, 11 to 20 Mbps: 21%, 10 Mbps: 26%, 5 to 9 Mbps: 14%, Less than 4 Mbps: 19%
 Top Types of WAN Traffic
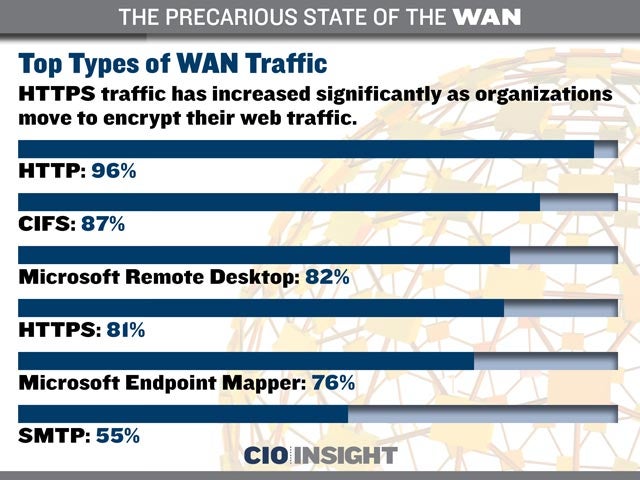
HTTPS traffic has increased significantly as organizations move to encrypt their web traffic. HTTP: 96%, CIFS: 87%, Microsoft Remote Desktop: 82%, HTTPS: 81%, Microsoft Endpoint Mapper: 76%, SMTP: 55%
 Top Types of WAN Traffic by Volume
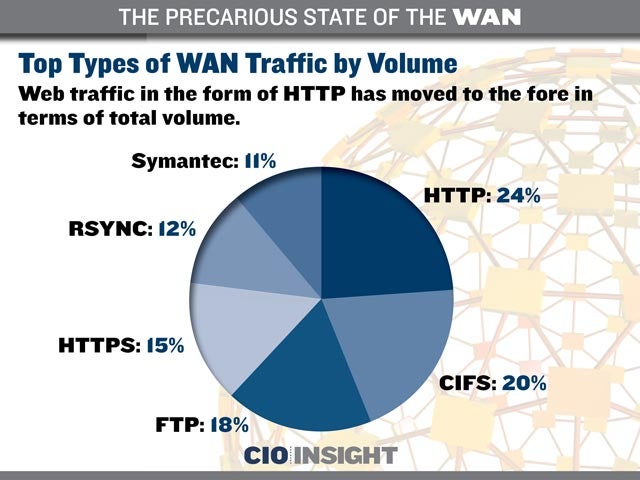
Web traffic in the form of HTTP has moved to the fore in terms of total volume. HTTP: 24%, CIFS: 20%, FTP: 18%, HTTPS: 15%, RSYNC: 12%, Symantec: 11%
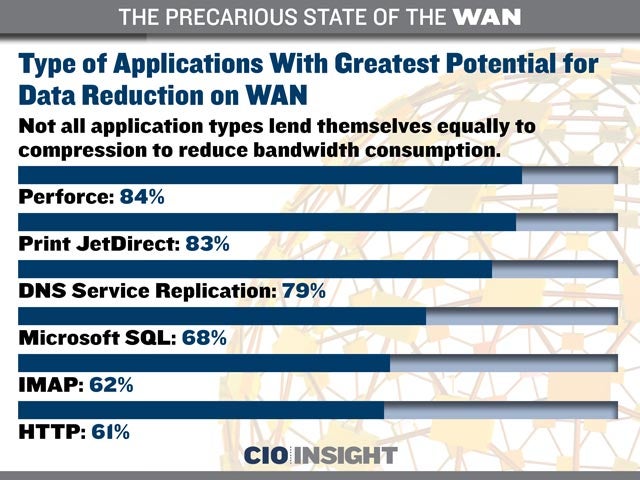 Type of Applications With Greatest Potential for Data Reduction on WAN
Not all application types lend themselves equally to compression to reduce bandwidth consumption. Perforce: 84%, Print JetDirect: 83%, DNS Service Replication: 79%, Microsoft SQL: 68%, IMAP: 62%, HTTP: 61%
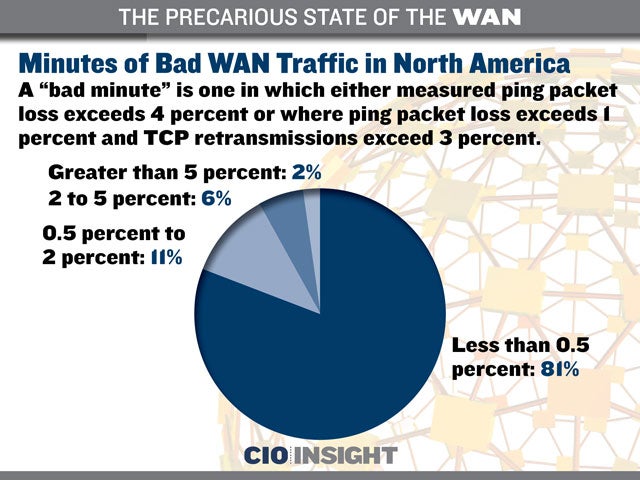 Minutes of Bad WAN Traffic in North America
A “bad minute” is one in which either measured ping packet loss exceeds 4 percent or where ping packet loss exceeds 1 percent and TCP retransmissions exceed 3 percent., Less than 0.5 percent: 81%, 0.5 percent to 2 percent: 11%, 2 to 5 percent: 6%, Greater than 5 percent: 2%
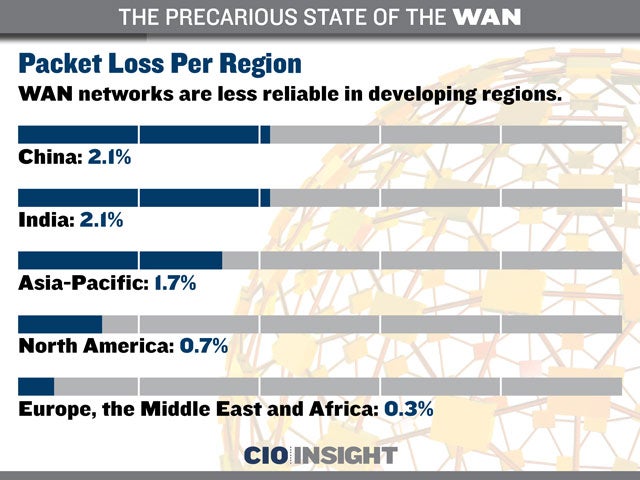 Packet Loss Per Region
WAN networks are less reliable in developing regions. China: 2.1%, India: 2.1%, Asia-Pacific: 1.7%, North America: 0.7%, Europe, the Middle East and Africa: 0.3%
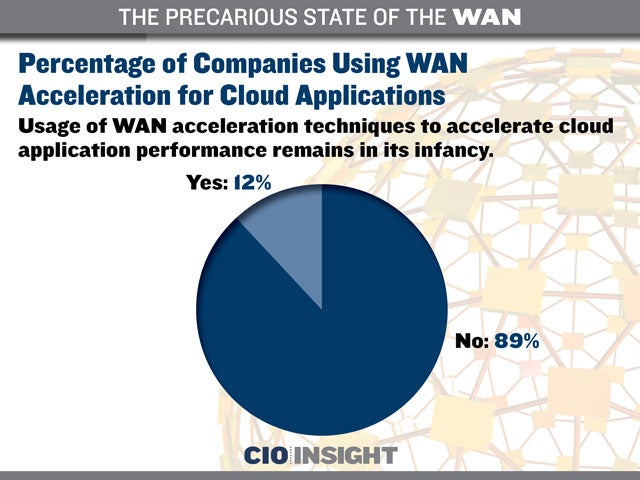 Percentage of Companies Using WAN Acceleration for Cloud Applications
Usage of WAN acceleration techniques to accelerate cloud application performance remains in its infancy. No: 89%, Yes: 12%
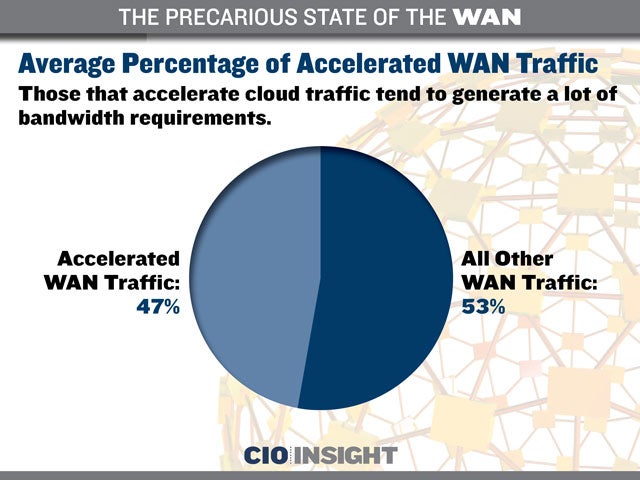 Average Percentage of Accelerated WAN Traffic
Those that accelerate cloud traffic tend to generate a lot of bandwidth requirements. All Other WAN Traffic: 53%, Accelerated WAN Traffic: 47%